Sunday, July 20, 2008

MEANING

The meaning behind my symbol:
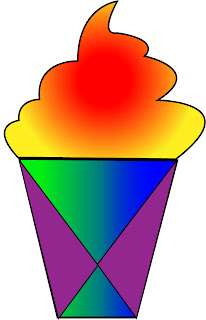
Name: HOT ICE CREAM.


I bet each of us have eaten ice cream AT LEAST once before. Even if you're not a big fan of ice cream, you would have tasted one before. How can an ice cream be hot? How can ICE be hot? Even fried ice cream, you can still feel the coldness of the ice cream. Creating an oxymoron here.hehe. How can hot be cold? how can cold be hot?hehee.. still with me? Just to make you think a little.

The ice cream is actually a metaphor to represent "WEATHER CHANGES". My area of awareness. Ice cream is meant to be cold and icy. This ice cream looks like it's glowing. Looks like it's hot. It looks like there is heat present.
Thus, this is a representation of "WEATHER CHANGE".

The weather has been irregular. Weathers around the globe are varying. We've seen snow in summer. Snow melting away during winter due to excessive heat from the sun. Unpredictable tropical weathers, where sometimes the sun is shining brightly and a few minutes later, it starts to pour. Sometimes it's hot and shopping complexes will be flooded with people and cars. Sometimes it rains heavily that we see cars flooded by rain water.

The cone consists of curvy shapes. It not only represents how ice cream looks like on a cone. BUT,
The curves show unsteadiness. It represents the unstable weather we are facing now due to global warming. The straight lines of the cones represents steadiness, where if there is no global warming, we will have stable weather. The 'X' sign in the middle of the cone represents disagreement. It is to show the dissatisfaction towards global warming. I will explain the two triangles later.

Moving on, the colours. The ice cream,consisting of the combinations of yellow,orange and red, represents, the sun. Basically, it's to show the heat and the feeling of 'hot'. Where the ice cream is suppose to be cooling, yet it's hot. The cone, using the gradient effect, I use the combination of green and blue. It's to represent the earth. It's to show that global warming is happening globally. It is not only happening in Malaysia, but other places too. Thus, the two triangles. It is now a blur whether we have 6 or 7 continents. Based on the website, http://geography.about.com/od/learnabouttheearth/qt/qzcontinents.htm, It varies. I'm gonna take it that we have 6 continents. The 6 points of the triangles are to represent the 6 continents. The two triangle meet in the center point.
What I'm trying to point out is that, we should ALL unite to stop global warming. Hence, the purple, used to colour both the triangle. I view purple as the colour of UNITY and VICTORY.

When unity is achieved among all the people of this earth, VICTORY is definite.


VICTORY, the end of global warming.

So, we should all unite to make sure that the earth will not be destroyed any further. It is our actions that matter most now. What are we going to do to stop global warming? When are we going to take action? When are we going to put an end to all this? How long more do you want the earth to suffer? How long more does it take for us to realize our mistakes?
TAKE TIME TO REALIZE.


One step at a time.

*mind you, the happy doll there is too expressed happiness for the completion of this assignment..not referring to global warming = P *

IT'S DONE!!!!! FINISHED!!
If I were to create a animation to express my feelings right now.. it would be jumping up and down.. wearing a party hat.. wit confetti coming down.. a little exaggerated? = P
Anyways, this has really been a fun and exciting process... This is gonna be a long post.. because I want to put everything in here.. to show my progress.. sit tight and enjoy = )

*Preferably, get some popcorn, a nice cold drink, ready your chair with a comfortable cushion.. make sure your feeling comfy and just enjoy... = D *

MY FOOTPRINTS FOR ASSIGNMENT 1:

I started with doing some research on Global Warming, as you can see in the previous posts. While reading through the article, something of interest struck me. WEATHER CHANGES. I then moved on to my sketches. I got some of the ideas from those images I found online.

I actually came up with another design and already showed it to my tutor, Dr Koo. But, recently, I have been having cravings for ice cream. Even though, I had the chance to eat ice cream, I now crave MANGO ICE CREAM! While I was doing some work, my mind was subconsciously thinking about ice cream. Then, it's like a light bulb wen 'ting'.. = P I tot maybe I should use the ice cream concept.

That was the beginning of my journey. Here comes the harder part of my journey, Using illustrator to illustrate my idea.

Step 1: Creating the Cream
I start of by using the pen tool to create the cream part. I named the layer "cream".


This is the end product of the 'cream'.


Step 2: Creating the Cone.
I, again, used the pen tool to create the cone. I put this into another layer called "cone."


Step 3: Creating the lines
I use the pen tool to create the 'X' in the cone.

Thus, the cone is completed.

Step 4: Colouring the Cone

I coloured the cone with 3 colours. Yellow on the outside,orange in the middle and red on the inside. I used the gradient tool to create this effect.

Step 5: Colouring the Cone

Next.... I coloured the cone. I use the combination of green and blue. I used the gradient tool again to create this two colour toning effect.


Step 6: Colouring the other side of the cone

I coloured the other side of the cone, purple. The swatch name is R=147 G=39 B=143.

Step 7: The product.

When combining the cone and the cream. This is the product of it.

Step 8: Final Product
After much thoughts and after doing some touch-ups. I decided to change the image to this.


Step 9: FINAL FINAL PRODUCT.

This is where the animation comes in. Confetti and party music in the background. = P
This is the end of my journey for assignment 1. My footprints so far. Hope you lasted till here. = ) Join me in the next post to know more about the meanings.

Thursday, July 17, 2008


I was having cravings for ice cream this past few days. I decided to change my design. I based my design on ice cream. = )

tune in... = D

Source: http://kidshealth.org/kid/talk/qa/images_59728/ice_cream.gif
(craving for mango ice cream....)

pictures


Picture references:
http://www.travel-location-blog.com/data/media/13/global-warming-symbol_835.jpg(polar bear)
http://www.oneclimate.net/imagelib/usergroups/20070413/IntClimateSymbol150gl_1.gif(earth-climate)
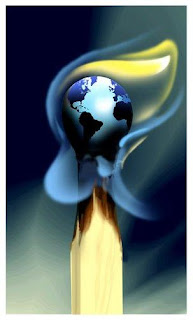
http://www.effectofglobalwarming.com/(candle-earth)
http://tbn0.google.com/images?q=tbn:lmsdGybhV2n7-M:http://www.dreamstime.com/smiling-planet-earth-cartoon-2-thumb2794723.jpg(earth)
http://www.mdbc.gov.au/subs/The_River/september2006/images/climate-change.jpg
http://thumbs.dreamstime.com/thumb_73/1153789284jI008B.jpg
http://www.germanfiredept.org/NEIGHBORHOOD/sad-ice_cube_cartoon.gif

Research on GLOBAL WARMING

Firstly, I started my assignment by doing researches about GLOBAL WARMING:

Global warming is the increase in the average measured temperature of the Earth's near-surface air and oceans since the mid-twentieth century, and its projected continuation.
The term "global warming" refers to the warming in recent decades and its projected continuation, and implies a human influence.[11][12] The United Nations Framework Convention on Climate Change (UNFCCC) uses the term "climate change" for human-caused change, and "climate variability" for other changes.[13]. The term "climate change" recognizes that rising temperatures are not the only effect.[14] The term "anthropogenic global warming" (AGW) is sometimes used when focusing on human-induced changes.

Causes

Components of the current radiative forcing as estimated by the IPCC Fourth Assessment Report.

The Earth's climate changes in response to external forcing, including variations in its orbit around the Sun (orbital forcing),[15][16][17], changes in solar luminosity, volcanic eruptions,[18] and atmospheric greenhouse gas concentrations. The detailed causes of the recent warming remain an active field of research, but the scientific consensus[19][20] is that the increase in atmospheric greenhouse gases due to human activity caused most of the warming observed since the start of the industrial era. This attribution is clearest for the most recent 50 years, for which the most detailed data are available. Some other hypotheses departing from the consensus view have been suggested to explain most of the temperature increase. One such hypothesis proposes that warming may be the result of variations in solar activity.[21][22][23]

None of the effects of forcing are instantaneous. The thermal inertia of the Earth's oceans and slow responses of other indirect effects mean that the Earth's current climate is not in equilibrium with the forcing imposed. Climate commitment studies indicate that even if greenhouse gases were stabilized at 2000 levels, a further warming of about 0.5 °C (0.9 °F) would still occur.[24


Temperature changes

Two millennia of mean surface temperatures according to different reconstructions, each smoothed on a decadal scale. The unsmoothed, annual value for 2004 is also plotted for reference.
Main article: Temperature record

Recent

Global temperatures on both land and sea have increased by 0.75 °C (1.35 °F) relative to the period 1860–1900, according to the instrumental temperature record. This measured temperature increase is not significantly affected by the urban heat island effect.[55] Since 1979, land temperatures have increased about twice as fast as ocean temperatures (0.25 °C per decade against 0.13 °C per decade).[56] Temperatures in the lower troposphere have increased between 0.12 and 0.22 °C (0.22 and 0.4 °F) per decade since 1979, according to satellite temperature measurements. Temperature is believed to have been relatively stable over the one or two thousand years before 1850, with possibly regional fluctuations such as the Medieval Warm Period or the Little Ice Age.[citation needed]

Sea temperatures increase more slowly than those on land both because of the larger effective heat capacity of the oceans and because the ocean can lose heat by evaporation more readily than the land.[57] The Northern Hemisphere has more land than the Southern Hemisphere, so it warms faster. The Northern Hemisphere also has extensive areas of seasonal snow and sea-ice cover subject to the ice-albedo feedback. More greenhouse gases are emitted in the Northern than Southern Hemisphere, but this does not contribute to the difference in warming because the major greenhouse gases persist long enough to mix between hemispheres.[citation needed]

Based on estimates by NASA's Goddard Institute for Space Studies, 2005 was the warmest year since reliable, widespread instrumental measurements became available in the late 1800s, exceeding the previous record set in 1998 by a few hundredths of a degree.[58] Estimates prepared by the World Meteorological Organization and the Climatic Research Unit concluded that 2005 was the second warmest year, behind 1998.[59][60] Temperatures in 1998 were unusually warm because the strongest El Niño-Southern Oscillation in the past century occurred during that year.[61]

Anthropogenic emissions of other pollutants—notably sulfate aerosols—can exert a cooling effect by increasing the reflection of incoming sunlight. This partially accounts for the cooling seen in the temperature record in the middle of the twentieth century,[62] though the cooling may also be due in part to natural variability. James Hansen and colleagues have proposed that the effects of the products of fossil fuel combustion—CO2 and aerosols—have largely offset one another, so that warming in recent decades has been driven mainly by non-CO2 greenhouse gases.[63]

Paleoclimatologist William Ruddiman has argued that human influence on the global climate began around 8,000 years ago with the start of forest clearing to provide land for agriculture and 5,000 years ago with the start of Asian rice irrigation.[64] Ruddiman's interpretation of the historical record, with respect to the methane data, has been disputed.[65]


Pre-human climate variations

Curves of reconstructed temperature at two locations in Antarctica and a global record of variations in glacial ice volume. Today's date is on the left side of the graph.
Further information: Paleoclimatology
See also: Snowball Earth

Earth has experienced warming and cooling many times in the past. The recent Antarctic EPICA ice core spans 800,000 years, including eight glacial cycles timed by orbital variations with interglacial warm periods comparable to present temperatures.[66]

A rapid buildup of greenhouse gases amplified warming in the early Jurassic period (about 180 million years ago), with average temperatures rising by 5 °C (9 °F). Research by the Open University indicates that the warming caused the rate of rock weathering to increase by 400%. As such weathering locks away carbon in calcite and dolomite, CO2 levels dropped back to normal over roughly the next 150,000 years.[67][68]

Sudden releases of methane from clathrate compounds (the clathrate gun hypothesis) have been hypothesized as both a cause for and an effect of other warming events in the distant past, including the Permian–Triassic extinction event (about 251 million years ago) and the Paleocene–Eocene Thermal Maximum (about 55 million years ago).


source:http://en.wikipedia.org/wiki/Global_warming

Assignment 1

TASK

You are to select an ASPECT or AN EFFECT of global warming. In other words, you are to research the meaning of global warming and choose one area to focus on such as weather change, melting of the ice caps, de-forestation, rising prices and so on.

You will have to do research on the GLOBAL WARMING to understand and to select an area of choice.

Assignment 1 – SYMBOL OF AWARENESS (10%)

You are to design, using Illustrator, a symbol based on the area of global warming that you have chosen. This symbol is to be used to create an awareness of the area of your choice. For example, a symbol could be designed to represent the polar ice caps melting or a tree-like symbol to represent de-forestation.

Requirements

1) Ideation must first be drawn. In other words, you are to draw your idea on paper first prior doing it in Illustrator. The process of ideation to final output must be documented on a blog or web log that all students must create.

2) The symbols should be made out of shapes only. It should be based on your area of choice about Global Warming. No text, no human or animals symbols. Just plain shapes.

3) The symbol should be in colour. The colour should have meaning to the symbol.

4) The shapes should be a metaphor of the area you have chosen. For example, if you like cars, it could be used to represent rising fuel prices.

5) Size of the symbol – A3

6) Printout the symbol and mount it on an A3 mounting board.

7) The other side of the mounting board must contain a write-up page. The write-up page must contain - the title of the symbol, the meaning of the symbol, its metaphor, the meaning of the shape of the symbol and the meaning of the colour of the symbol and the relation to the area of global warming of your choice.

8) Include your name, ID and group at the back of the mounting board.

Documentation to be done on the BLOG

(1) Include the RESEARCH you have done on the area of choice (add the web links).
(2) Include the idea of the symbol, its meaning and so on. This could be similar to the write-up.
(3) Include designs, sketches, references or images that you use to create your symbols, tools that you used and the final output.
(4) Tools used. You are to EXPLAIN the tools that you used and learnt from the tutorials and EXPLORED.

Submission:

  1. Students must submit the Illustrator file and title it studID_symbol a. Date of Submission: Week 6 in tutorials to tutorial Group Leader.
  2. The student name, ID and Group must also appear inside the document. Marks will be deducted if you do not enter your name, group and ID properly. Marks will also be deducted if there are no name, ID and group.
  3. All class submission guidelines must be followed. Not following these requirements will mean a reduction in your marks in this exercise.
  4. Any copying or similar symbols may result in the students getting an automatic "0" mark.

Criteria for marking:

(1) The concept itself and the proof of concept which are the sketches, references and research.
(2) Design of the symbol and symbol write-up.
(3) Use of the tools - the proper and creative use of the tools
(4) Write-up and documentation must be in proper English.
(5)
Detail description of the process.
(6) Quality of the printing and display.

Tuesday, July 8, 2008

Footprints

I think it's high time that I post up my 1st post on this blog. I'm Caryn, from MC012. The purpose of this blog is to show the progress of my assignments, in computer graphics class. Maybe right now, You're filled wit curiosity and probably wondering why I named this blog "The Footprints of My Computer Graphics". Why footprints? Why not hand prints? Why?

Well.... I have always LOVED the story, 'The Footprints in the Sand'. It represents my life. You can Google up the story if you want to know what the story is about = ). I believe in life, we make footprints. We are on a journey. A journey of life. So we leave behind footprints as we walk. Imagine walking on a beach, where the footprints of a person is visible as he walks along the sandy beach.

So... hehehehe.. In computer graphics class, it's going to be a journey. A journey of discovering Illustrator etc. A journey of discovering new things. So yea, thus the name...
"The Footprints of My Computer Graphics".

I'm not going say much about myself. Just that, I'm a MMU student. I'm a FCM student. I hail from KL but was raised in Ipoh. So I guess I'm more Ipoh than KL. = P Being here for almost a month, my whole perspective of creativity, art and so on, is slowly changing, As I learn new things week after week. Which is really fun, exciting and a really good experience.

So, this is my introduction. This is my journey. These are my footprints. The footprints of my computer graphics. = )